
What's actually been measured, rather than future projections. Where a figure is a snapshot in time, it's dated.
📈 Greenhouse gases are rising
Ice cores from Antarctica let scientists measure ancient greenhouse gas levels precisely. Before industrialisation, atmospheric CO₂ sat at around 280 parts per million (ppm) for a very long time. Today it's far higher, tracked continuously by monitoring stations worldwide.
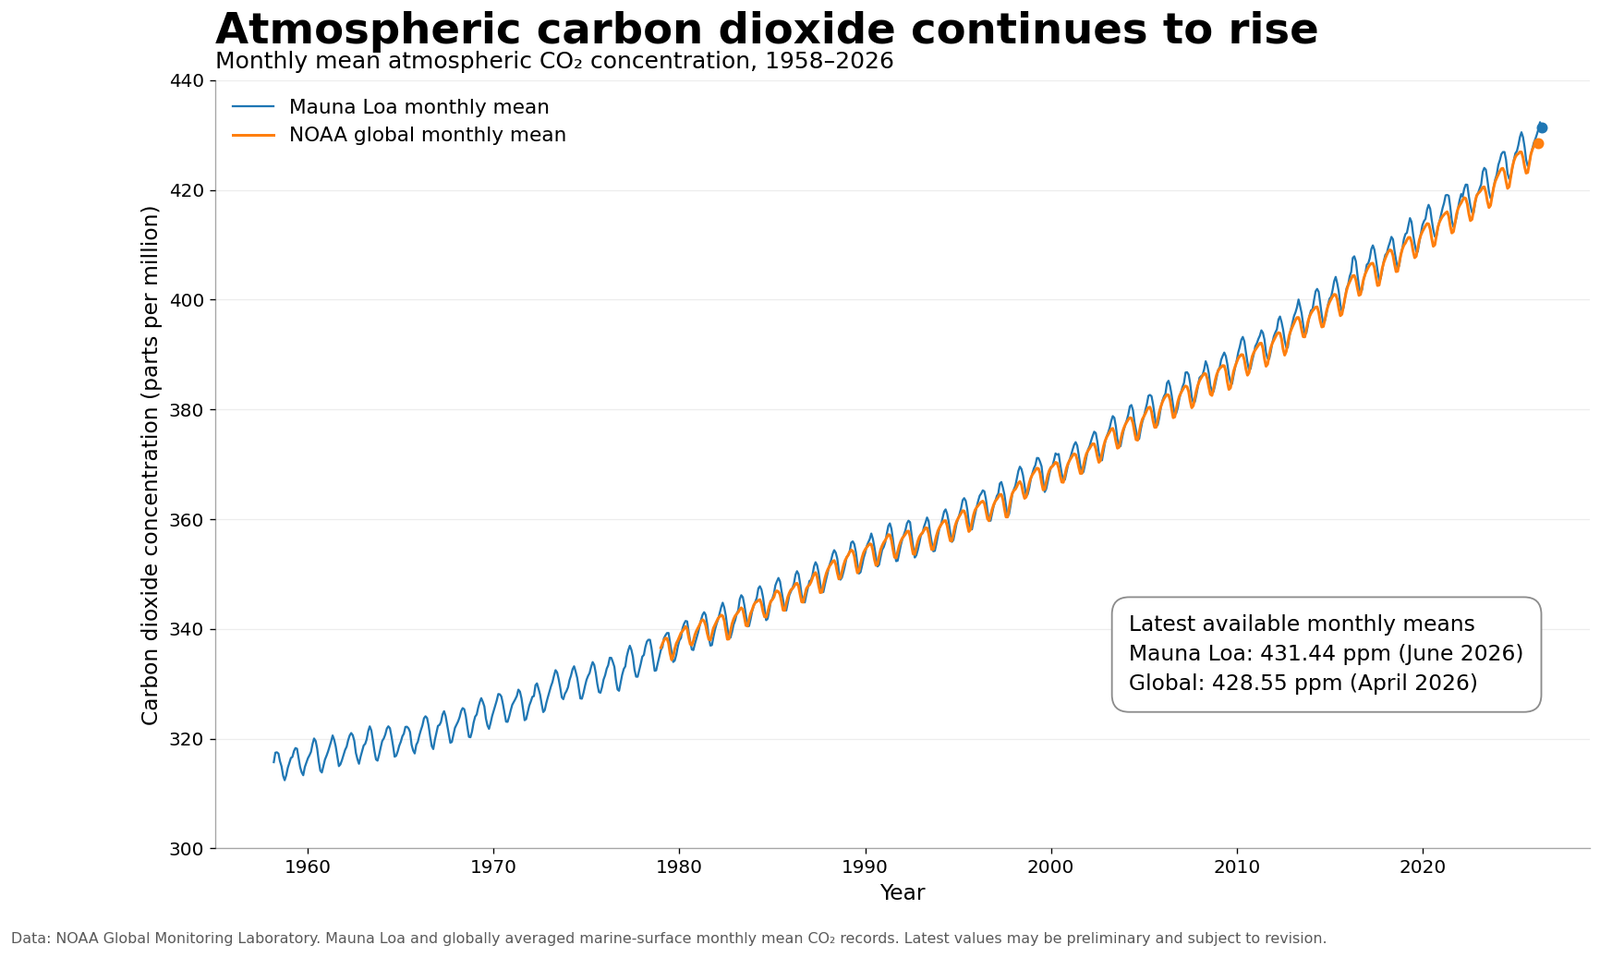
📊 Source: NOAA Global Monitoring Laboratory and Mauna Loa Observatory.
And it's not slowing down. Global CO₂ emissions hit a record high in 2025, according to the Global Carbon Budget, an annual assessment by over 100 scientists worldwide. Methane and nitrous oxide matter too. Methane is a particular watch point, with large amounts locked in Siberian permafrost that could release more as it thaws.
🌡️ Global temperature has risen
Compared with the 1850–1900 average, before most industrial emissions, global temperatures have risen enough that 2024 broke through the 1.5°C mark for the first time, a threshold long treated as a key marker in climate policy. Warming isn't even everywhere. It's stronger near the poles, which is why Arctic change is often the most visible sign.
In the UK: the Met Office's State of the UK Climate report found the UK has warmed roughly 0.25°C per decade since the 1980s. 2025 was the UK's warmest year on record (dating back to 1884), the sixth time this record has been broken this century. The last four years all rank among the UK's five warmest. In 2022, the UK hit 40°C for the first time (40.3°C, at Coningsby, Lincolnshire).
🌊 Sea level is rising
Global mean sea level has risen roughly 20cm since 1900. UK sea levels specifically have risen 19.5cm since 1901, with the last three years the highest on record.
🔑 Two things drive this: warming ocean water expanding, and melting land ice (mainly Greenland and Antarctica) adding water to the oceans.
🧊 Arctic sea ice is shrinking
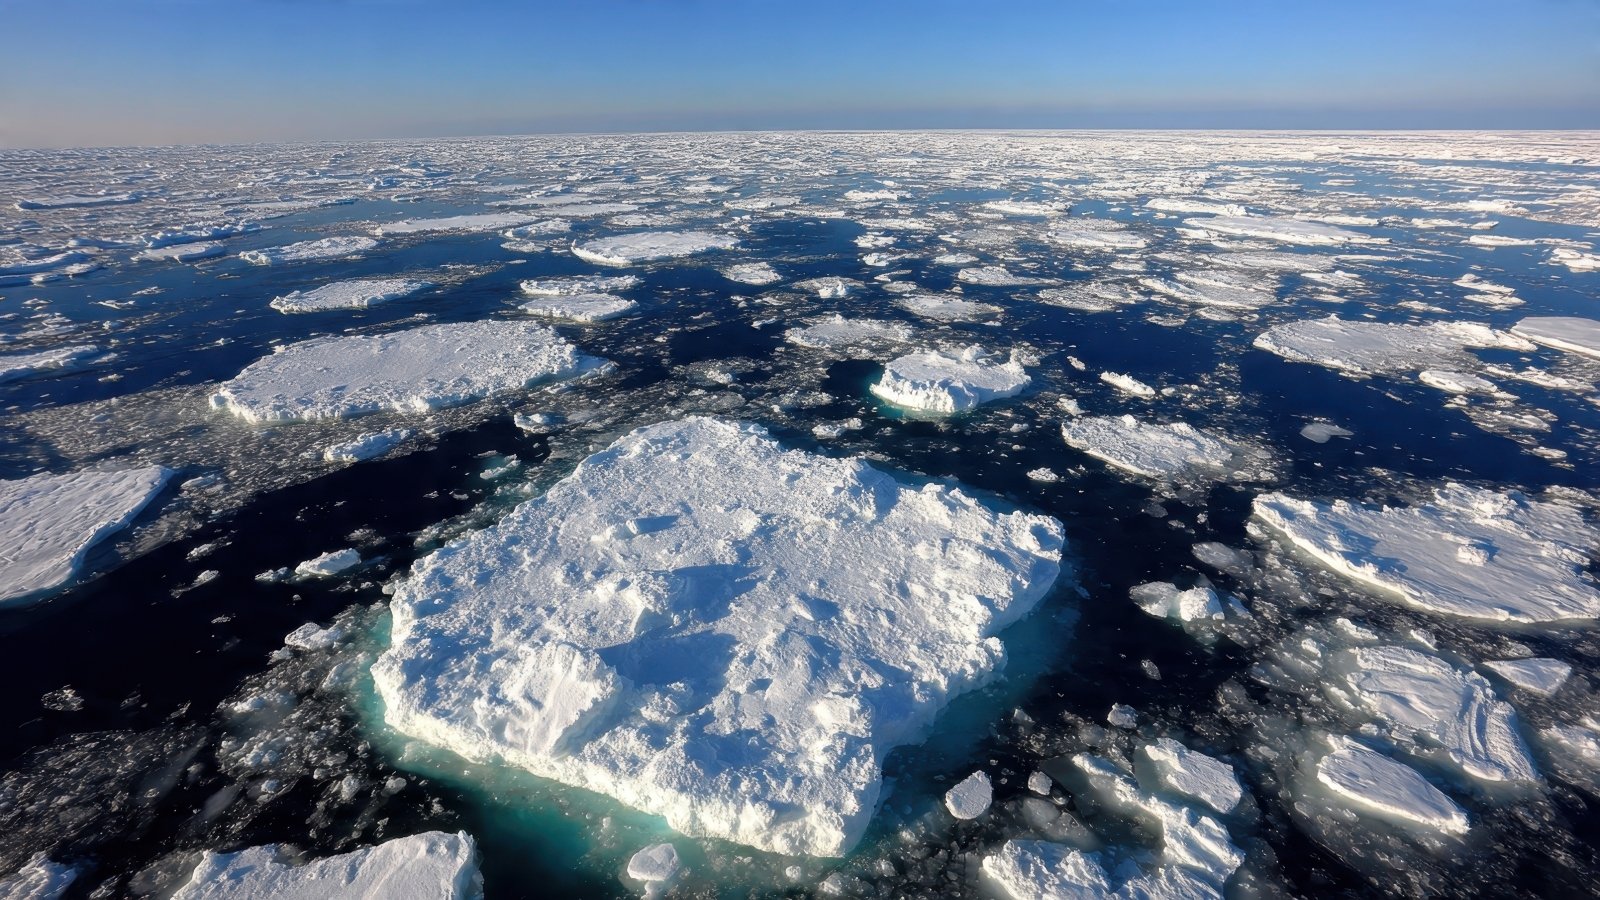
NOAA has tracked Arctic sea ice by satellite since 1980. Comparing the September minimum, when Arctic ice is smallest each year, between 1980 and now shows a substantial, ongoing loss.
🏔️ Glaciers are retreating
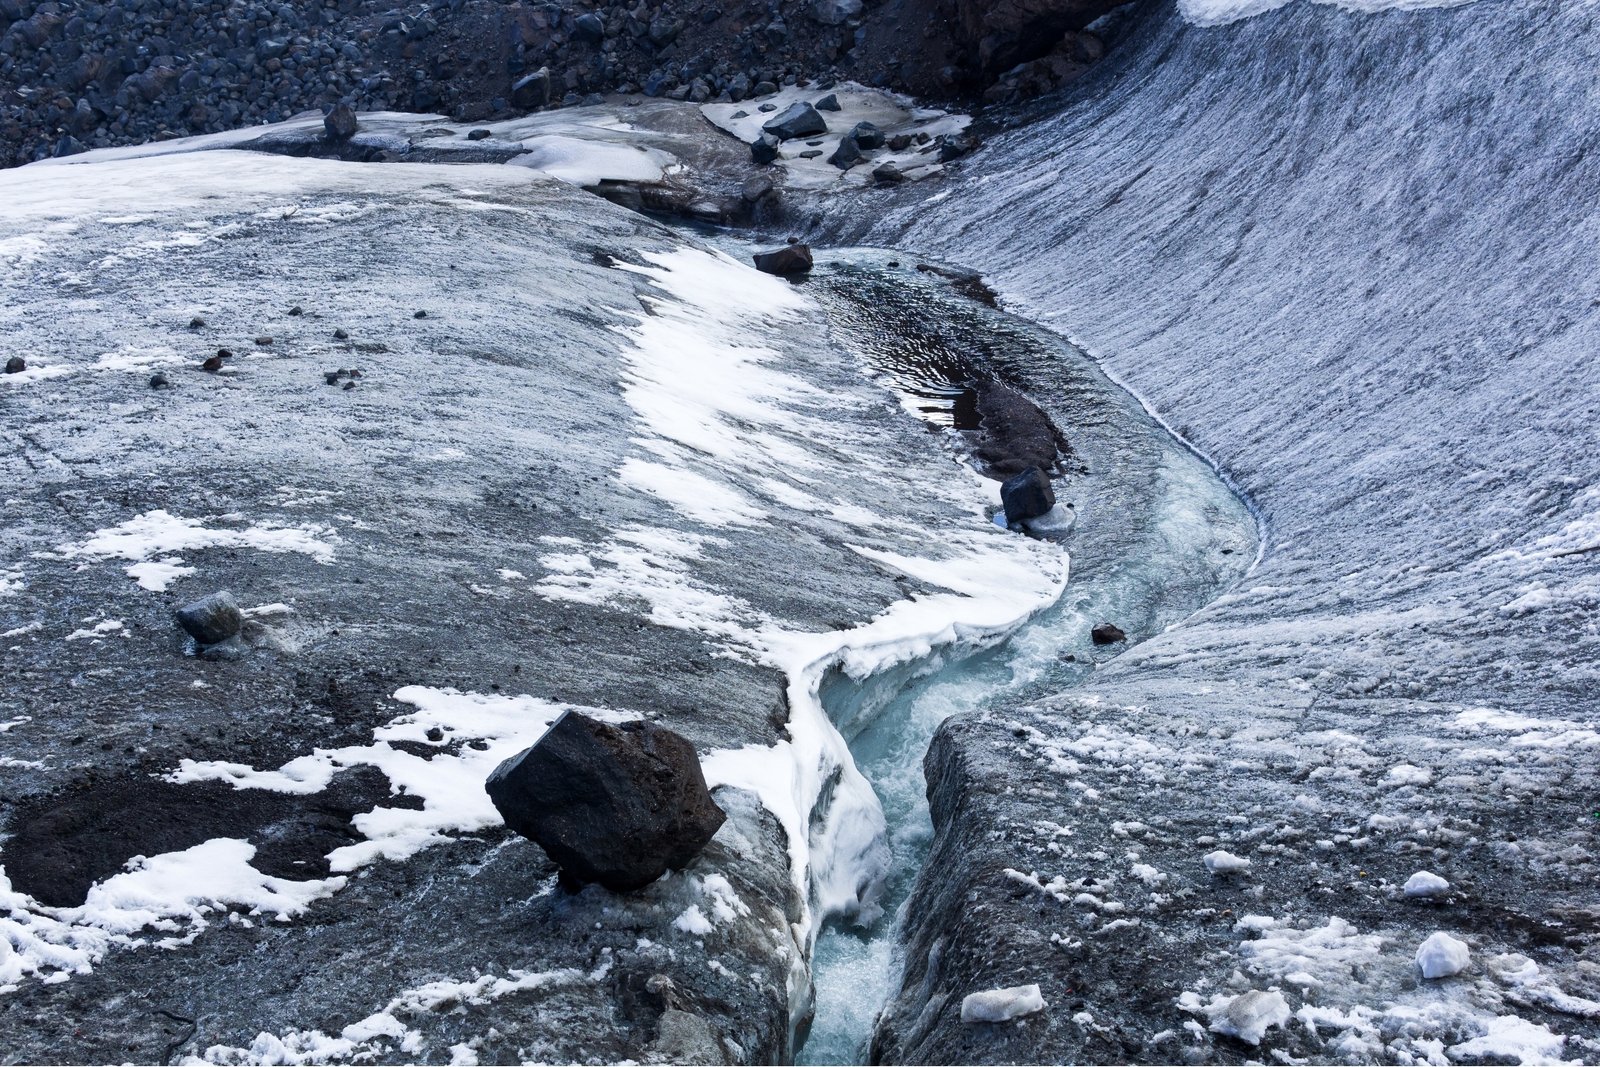
The most comprehensive study to date, a 2025 Nature paper from over 450 scientists worldwide, found the world's glaciers lost an average of 273 billion tonnes of mass every year between 2000 and 2023, adding around 18mm to global sea level. Loss is accelerating: 2023 was the worst year on record.
⚡ Extreme weather is already being influenced
Climate change is already affecting how likely, and how severe, extreme events are. Scientists can now often estimate this using attribution science. Two examples:
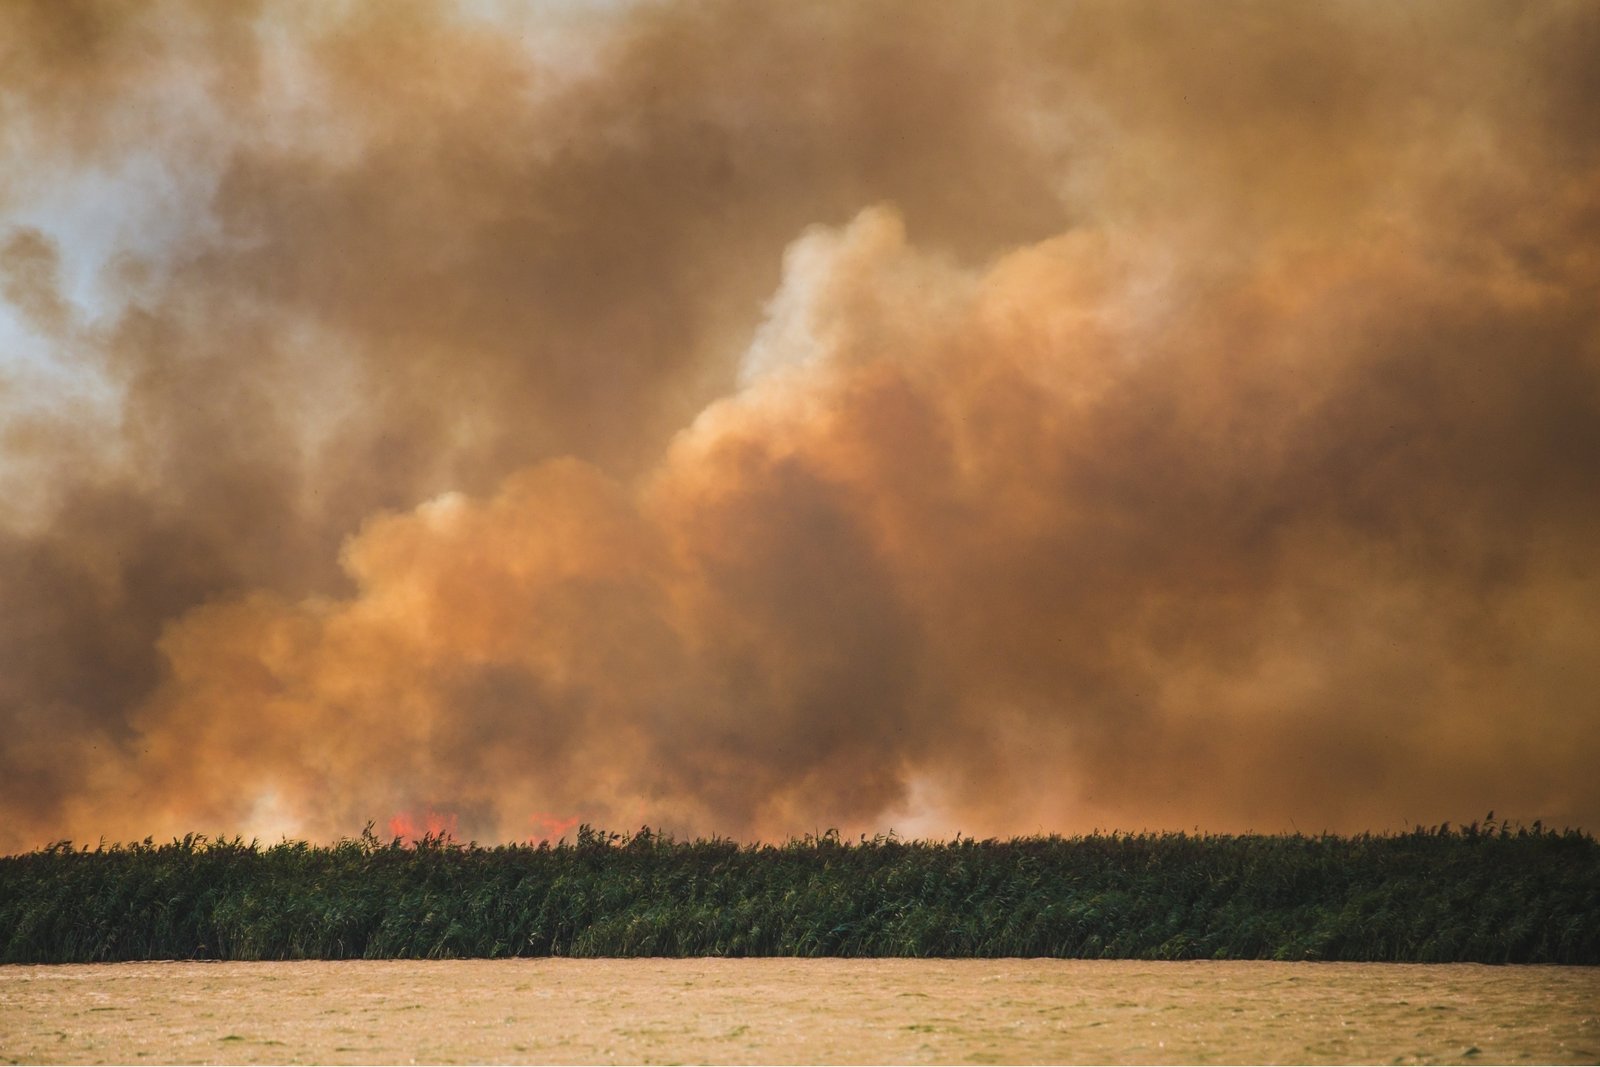
Siberian heatwave, 2020
A prolonged heatwave over the first half of 2020 drove wildfires and permafrost loss. Assessed as ~600× more likely because of climate change.
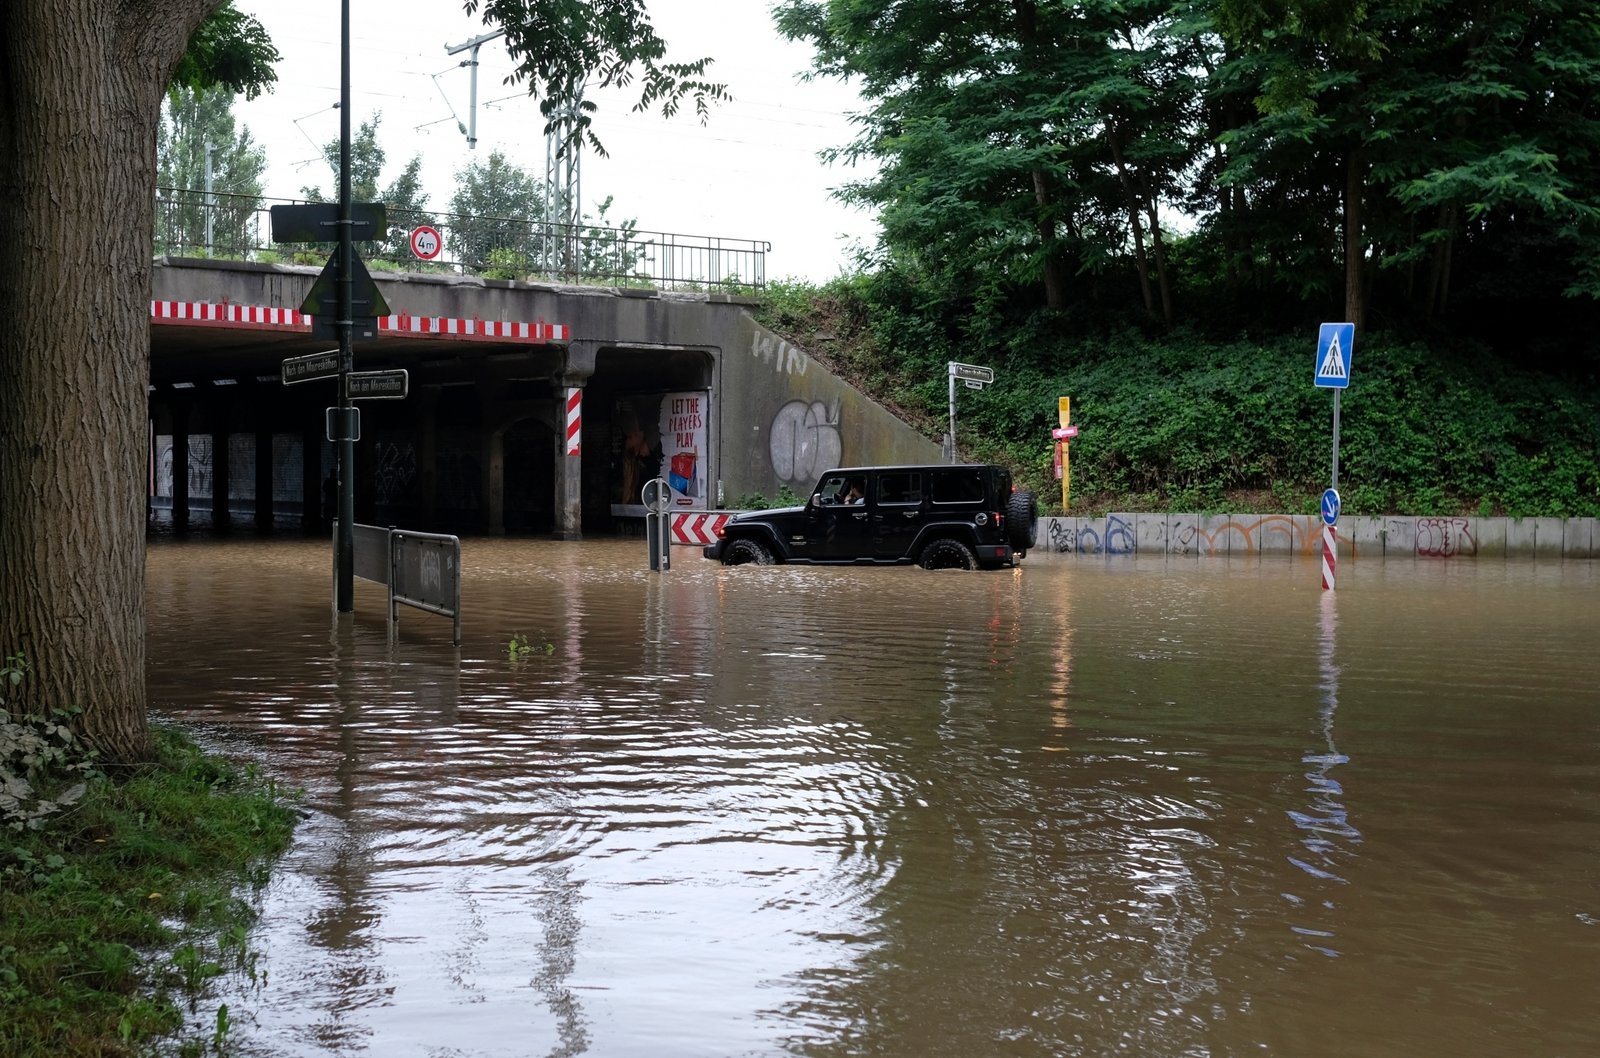
European flooding, July 2021
Caused over 200 deaths. Assessed as 1.2–9× more likely, with rainfall intensity 3–19% higher.
📌 A third example: A June 2021 heatwave that set a Canadian record of 49.6°C was assessed as almost impossible without human-caused climate change.
❓ What's still uncertain
⚖️ Some evidence here is unambiguous: temperature rise, sea level rise and Arctic ice loss. Some isn't: UK trends in heavy rainfall and windstorms are still inconclusive, even though both are expected to increase with warming.
See what the projections show for how confident scientists are in what happens next.