
SEPA and Scottish Water data on what's shifting north of the border, and what's driving it.
💡 Worth knowing: most figures below are UK-wide or English, because that's what the underlying data mostly covers. Where a figure is specific to Scotland, or specifically isn't, this page says so.
🌊 Flooding
A warmer atmosphere holds more moisture, roughly 7% more per 1°C of warming, so when it does rain, it can rain harder.
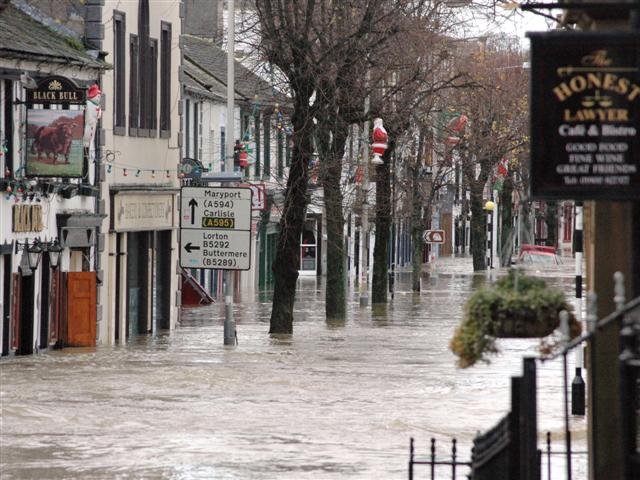
For local flood risk mapping, use SEPA's flood maps (Scotland's environment agency), not Environment Agency data, which covers England only.
🌊 Sea level rise and coastal erosion
This is the category most directly relevant to Findochty, and where the most important nuance sits.
🔑 Key nuance: Global sea level has risen roughly 20cm since 1900 and is projected to keep rising. But Scotland is projected to see less sea level rise than England and Wales because Scottish land is still slowly rising as a delayed response to the weight of ice-age glaciers lifting (glacial isostatic adjustment). Southern England is sinking slightly for the same reason, in reverse.
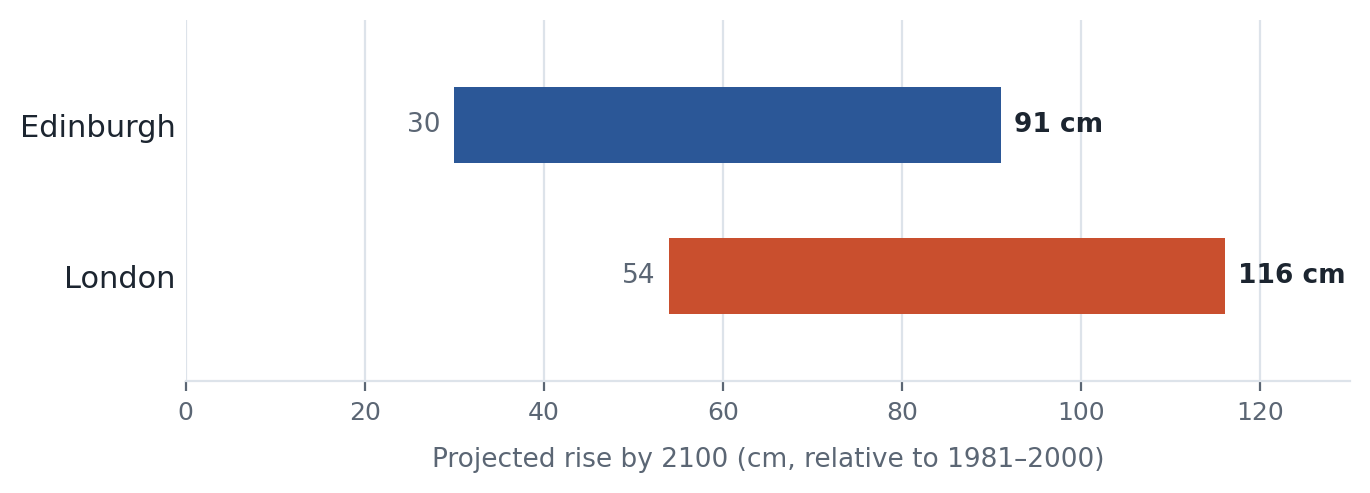
📊 Projected sea level rise by 2100, relative to 1981–2000. Edinburgh is used as the nearest city to Moray in the Met Office's table. It is not a Findochty-specific figure. Source: Met Office UK Climate Projections (UKCP18).
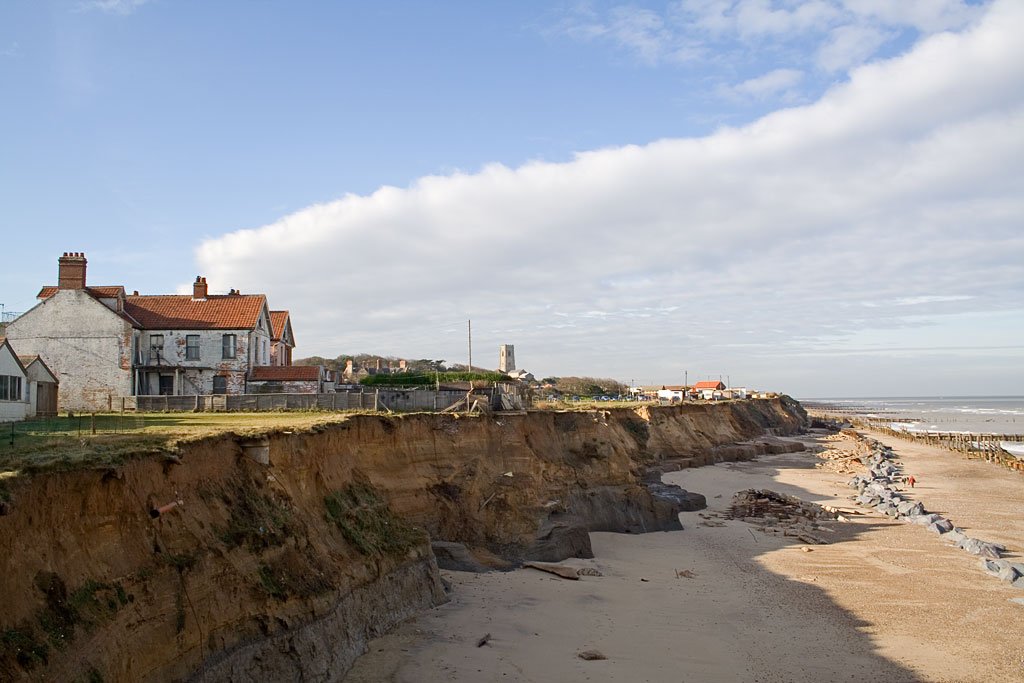
There's no Findochty-specific figure, so Edinburgh is the closest comparison available, not a direct prediction. This doesn't mean the coast here is unaffected: sea level is still rising, and combined with storm surges, greater coastal erosion risk is a reasonable expectation.
See Spotlight: Sterlochy Pier for what this means at Findochty's own known risk area.
🌡️ Extreme heat
The UK's temperature records have been broken repeatedly in recent years, and 2025 was the warmest on record. Scotland's coast typically sees less extreme heat than southern England, moderated by the sea. There's no Moray-specific figure, so no number is claimed here. But heat impacts like poor air quality and strain on infrastructure aren't limited to the hottest areas.
🔥 Wildfire
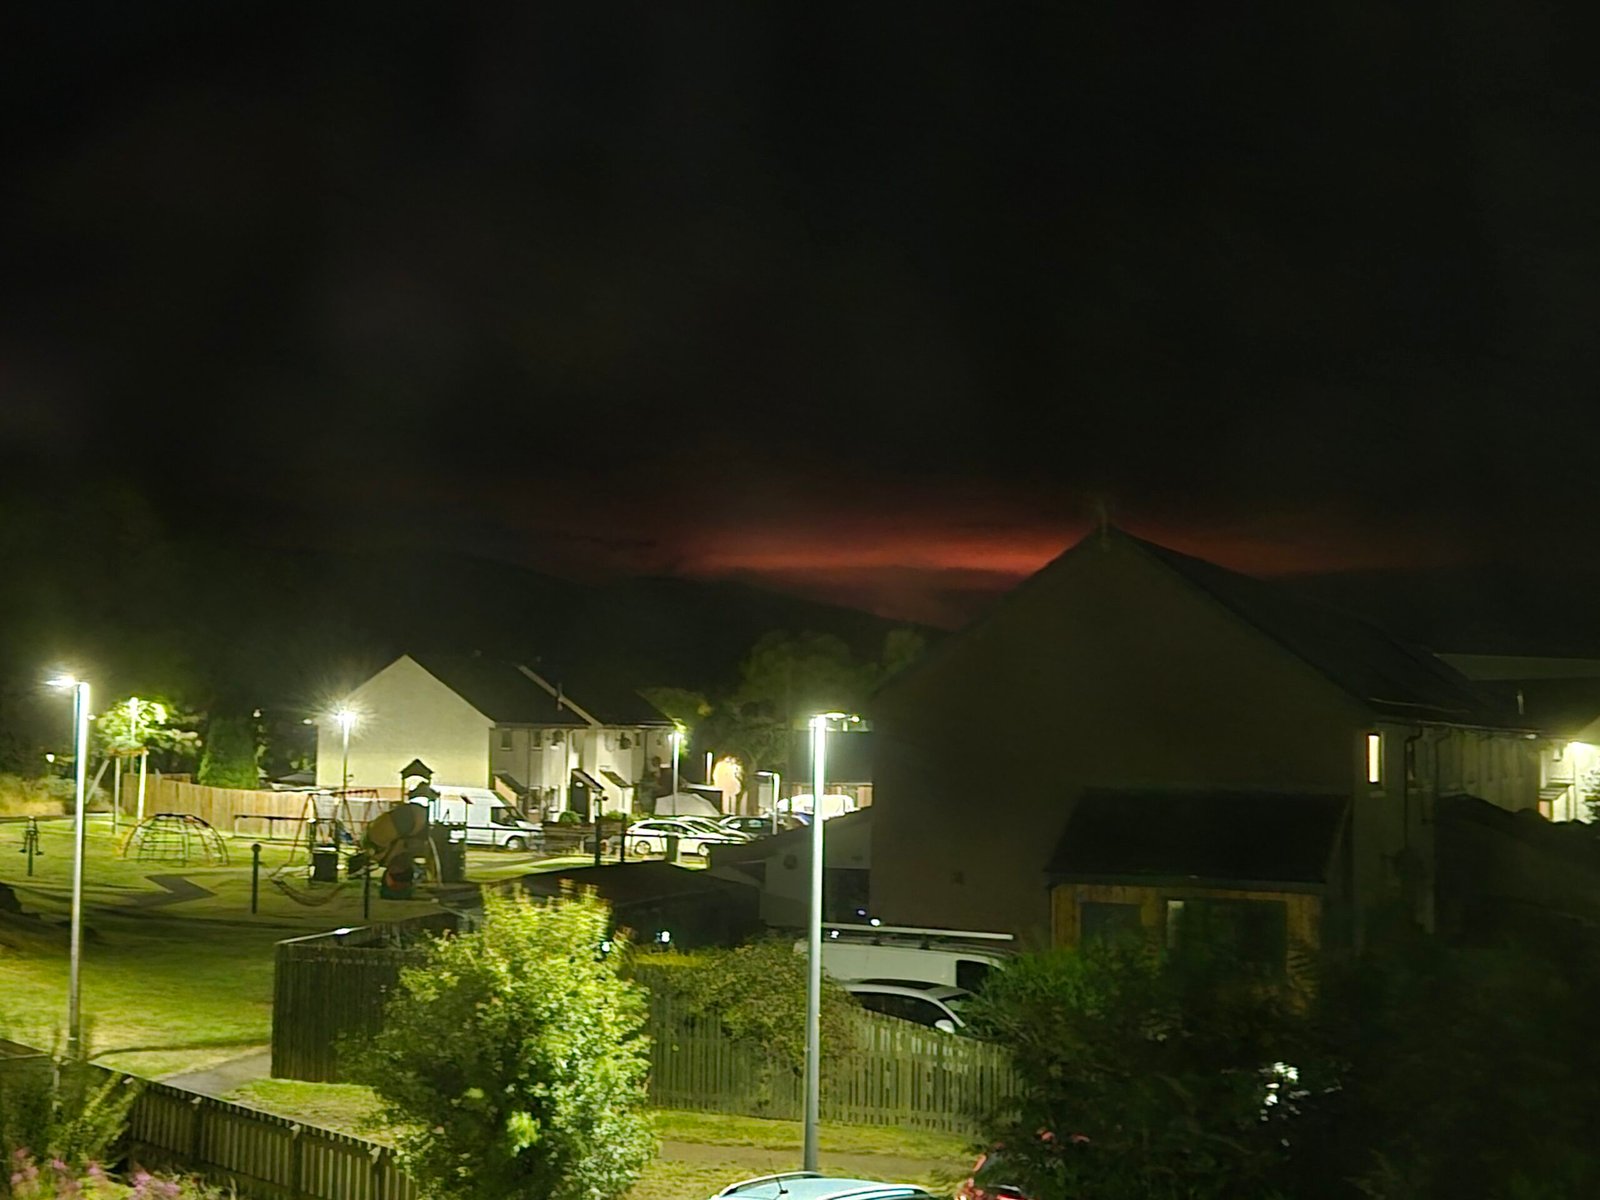
Scotland is one area the source material specifically flags: northern and upland regions have historically seen wildfires and are expected to continue to, driven by high temperature, low humidity, low rainfall, and high wind. 2025 was a record year for UK wildfire burnt area.
No formal attribution study exists yet for this specific fire, and this resource won't claim climate change caused it. What can be said: the general conditions driving UK wildfire risk are the same conditions behind this one. For current status, Scottish Fire and Rescue Service is the primary source. Anything written here will date quickly.
💧 Water supply
England is projected to need over 3.4 billion additional litres of water per day between 2025 and 2050. This isn't just theoretical: the State of the UK Climate 2025 report recorded the UK's driest spring in over 100 years, with most of England and Wales getting under half their average spring rainfall.
❄️ Milder winters
The flip side of extreme heat: winters are getting milder and less frosty. UK-wide, air frosts are down around 15% and ground frosts around 24% (2013–2022 vs. 1961–1990). Severe winters can still happen, just less often.
🌾 Agriculture
By 2070, potato blight occurrences in Eastern Scotland — a region with significant potato farming — could increase by around 70% under a high-emissions scenario, according to peer-reviewed Met Office research (Garry et al., 2021).
The pattern across all of these
⚖️ The bottom line: None of these risks are unique to Findochty, and some, especially sea level rise, may hit this coastline less hard than the figures most often quoted nationally. But "less severe than the worst UK case" isn't the same as "not a risk". Flooding, coastal erosion and wildfire are all directly relevant here.
For Findochty's own established flood risk area, see Spotlight: Sterlochy Pier.